Electronic mail has come a long way since its birth in 1971. It is one of the vital communication channels on the internet, with over 4 billion active users. Considering the vast user base, it has become an inseparable part of the marketing strategies for businesses.
In this blog post, you will find a list of useful email marketing statistics and facts.
Go through this blog post and make yourself aware of some crucial email marketing facts. It will help you build an effective marketing strategy for your business.
Useful Email Marketing Statistics For 2026
General Email Marketing Statistics
- Email marketing has an eye-catching ROI of $42 for every $1 spent.
- Email marketing revenue was $7.5 billion in 2020, which is expected to grow to almost 17.9 billion by 2027.

- One out of two media planners is using email marketing strategies, which was expected to increase by 22% in 2022.
- The number of emails sent & received per day was estimated to be around 361.6 billion in 2024, which was forecasted to reach 376.4 billion by 2025.
- In 2024, ,4481 billion email users were estimated to use emails as a part of their routine online life, and are estimated to climb up to 4.6 billion users by 2025.
- 37% of brands have increased their budget for email marketing.
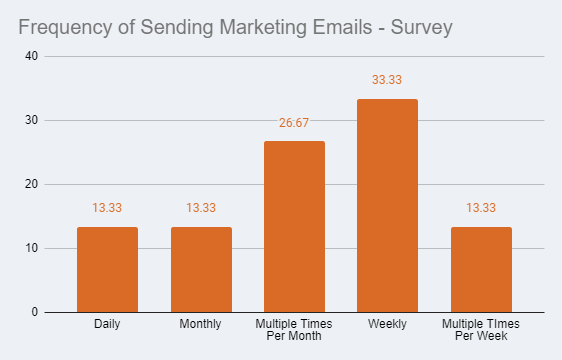
- 12% and 8% of marketers send emails weekly and multiple times per month, respectively. More details about the frequency of sending marketing emails are provided in the chart below.
- 63% of businesses reduce the frequency of emails based on the email’s interaction level.
- 70% of businesses have increased email marketing for their brands.
- 43% of marketers have changed their way of measuring email performance due to Apple’s Mail Privacy Protection.
- Testing your emails with QA, A/B, and spam testing can lead to a 28% higher ROI.
- 8% of email campaigns do not provide an unsubscribe link in emails.
Mobile Email Marketing Statistics
- Email communication is preferred by 61% of smartphone users.
- Apple iPhone email client was ranked first in the email market share in the previous year and still had the highest market share (57.72%) as of August 2022.
- 1 out of every 5 email campaign is not mobile-friendly.
- Mobile devices accounted for almost 28.80% of email addresses, tablets excluded.
- The average click-through rate of emails on mobile devices is 1.4%, excluding tablet devices.
- A responsive email design can improve mobile clicks by 15%.
- 24% of email marketers claim that Apple’s iOS 15 data privacy changes positively affected their marketing strategy.
- In-depth links for mobile email campaigns have fewer click rates than PC and tablets.
- 41% of people view their emails from their mobile devices, while 39% of views are from desktops.
- 42% of people will delete emails that are not properly optimized for mobile.
- Optimizing email marketing campaigns for mobile responsiveness can lead to 15% increase in mobile clicks.
- Mobile devices account for 41% of email addresses.
- 23% of consumers who check an email on a mobile device will check it again later.
B2B Email Marketing Statistics
- 90% of B2B marketers think tracking email engagement is the most effective metric to measure content performance.
- According to 44% of B2B marketers, email is one of the top three organic content distribution channels.
- Email is considered the most personal method of communication. Yet 89% of B2B email campaigns are sent using the company names.
- 44% of B2B marketers agree they prefer email newsletters for content marketing.
- 73% of B2B marketers say they use email marketing software for content marketing.
- 31% of B2B marketers say email newsletters are the most effective way to support leads.
- 64% of B2B marketers agreed on the effectiveness of email marketing strategy to successfully complete the business targets in 2021.
- Almost 16% of emails are lost or filtered by spam filters.
- Automation is the first priority in email marketing to send specific emails to support the campaign.
If you are in confussion regarding the way email marketing strategies are impacting Magento 2 you can optimize strategies by performing B2B and B2C comparisions.
B2C Email Marketing Statistics
- 87% of B2C marketers prefer automation for their email marketing strategy.
- 50% of subscribers buy from marketing emails once a month. 8 out of 10 customers in the United States subscribe to email newsletters only to receive coupon codes.
- You will get higher open and click rates if you send up to seven newsletters every week.
- Personalized emails are used by 55% of retail, eCommerce, and consumer goods and services companies based on previous purchases.
- Nearly 8 out of 10 people open a welcome email which leads to 4x as many opens and 10x as many clicks as compared to other email types.
- Autoresponder emails have the highest open rate and click-through rate, which are 39.7% – 54.5% and 3.2% – 6.7% respectively.
- Almost 22% of all emails are read within an hour.
- In a consumer survey, 59% of respondents agreed that marketing emails have influenced their purchase decisions.
Subject Line Email Marketing Statistics
- Around 47% of people will open an email based on the subject line.
- 69% of individuals will regard emails as spam based on the subject line.
- Emails that end up being the most successful are the ones that include promotional offers, and are ultimately personalized to each person’s preferences.
- Only the first 30 characters of a subject line are shown on the iPhone email app.
- Fridays have the highest 21.60% open rate.
Important Email Marketing Metrics
- The average email open rate is 32.55%
- The average email click-through rate is 3.25%.
- The average email click-to-open rate is 8.62%.
- The average email unsubscribe rate is 0.15%
- The education industry has the highest average email open rate and average email click-through rate, which are 28.5% and 4.4%, respectively.
- The Real Estate, Design, and Construction industry has the highest email click-to-open rate, which is 17.2%.
- The average email open rate witnessed a massive jump across the industry after the introduction of iOS 15 Mail Privacy Protection.
Day-wise Email Marketing Statistics
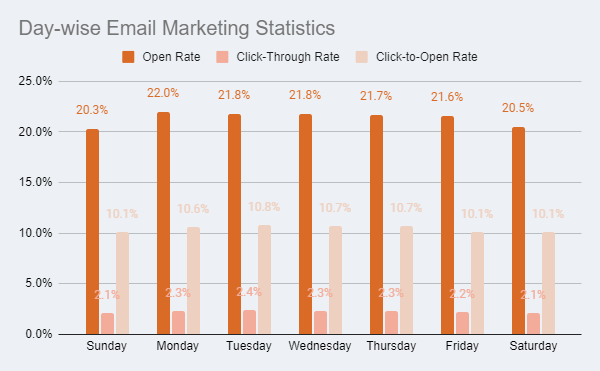
Preferable Days to Send Marketing Emails
- Monday has the highest email open rate of 22%.
- Tuesday has the highest email click-through rate of 21.80%.
- Wednesday and Tuesday have the highest click-to-open rates, which are 19.82% and 19.49% respectively.
- The best days to send emails are Tuesdays and Fridays.
- 8 am, 2 pm, and 5pm are usually the best times to send emails.
- Best day to send an email campaign is Thursday.
Undesirable Days to Send Marketing Emails
- Sunday has the lowest email open rate of 18%.
- Saturday and Sunday have the lowest email click-through rate of 1.4% and 1.7% respectively.
- Friday, Saturday, and Sunday have the lowest email click-to-open rate of 10.1%.
- Weekends are the worst days to send emails.
- The worst time to send an email is 5-6 pm.
- Worst day to send an email campaign is Saturday.
Region-wise Email Marketing Statistics

- The UK has the highest email open rate of finance industry with 39.5%.
- The Asia-Pacific (APAC) region is on the top with the highest click-through rate and the highest click-to-open rate of 2.83% and 20.32%, respectively. It also consists of the highest unsubscribe rate of 0.11% and 0.58% of bounce rate.
Email Marketing Demographics
- 99% of email users open their inboxes on a daily basis, with some of them opening more than ten times a day.
- 58% of email users say they check their inboxes as soon as they get up in the morning.
- In a survey conducted in the US, 35% and 28% of the participants had two and more than four email addresses, respectively.
- The average spending time of consumers for reading brand-related emails is 10 seconds.
- 40% of email users are positive about having a minimum of 50 unread emails in their inbox.
- Consumers in the US discover brand coupons mainly via email.
- 10.31% is the average email bounce rate across the industries.
- Smartphones are mainly used to check inboxes by 59% of Millennials.
- 67% of Generation Z check their inbox on mobile.
- The promotion tab is checked at least once a day by 53% of millennial Gmail users.
- 74% of Baby Boomers, 72% of Generation X, 64% of Millennials, and 60% of Generation Z use email as a personal channel to communicate with brands.
ROI Email Marketing Statistics
- Retail, ecommerce, & consumer goods: 45:1
- Marketing, PR, & advertising agency: 42:1
- Media, publishing, events, sports, & entertainment: 32:1
- Software & technology: 36:1
Email marketing is one of the most effective marketing strategies for eCommerce, with high ROI. With more than 60 different email marketing statistics provided in this blog, you can vouch for its effectiveness. You can use these email marketing statistics to craft a solid email marketing strategy for your business.
Other Useful Resources
- Artificial Intelligence Statistics
- Social Media Statistics
- Conversion Rate Optimization Statistics
- User-Generated Content Statistics
- Blogging Statistics
- Affiliate Marketing Statistics
- Coupon Statistics
Frequently Asked Questions (FAQ)
What Percentage of Emails are Read?
On average 21.5% of all emails are read, and almost 22% of the emails are read within an hour.
How Often Should I Send Marketing Emails?
The optimum frequency of sending marketing emails may vary as per your business and audience. Sending up to seven marketing emails per week (once a day) may not cause you any problems.
Which Day is Best to Send Marketing Emails?
The best days to send marketing emails are Monday, Tuesday, and Wednesday. Here is why.
Is the 20% Email Open Rate Good?
A good email open rate depends on the industry you are in. However, anything between 17% to 28% is considered a good email open rate.
Sources: Litmus 1, Statista 1, HubSpot 1, Statista 2, Litmus 2, HubSpot 2, Databox, HubSpot 3, Content Marketing Institute, Email Tool Tester, Statista 3, Litmus 3, MailChimp, Super Office, Getresponse, Litmus 4, Option Monster, Bluecore web, Constant Contact, HubSpot 4, Statista 4, Statista 5, Statista 6, Campaign Monitor