Did you search for this query Google search statistics on the Google search bar, and got multiple results that meet your search intent?
Well, that is how profoundly Google search is working.
It doesn’t just answer your question but offers you different options to make your experience better. Making it the most loved and used search engine.
In this blog post, we will dig into some refreshing Google search stats that paints a clear picture for us of how big this tech giant is and how easily it has become a big part of our lives.
Here We Have covered:
- General Google Search Statistics
- Google Search Engine Market Share Statistics
- Local Google Search Statistics
- Ecommerce Google Search Statistics
- Desktop vs. Mobile Search Statistics
- Paid Search Statistics
- Visual Search Statistics
So, let’s get into this!
General Google Search Statistics
- Each year, over 3.1 trillion searches happen on Google.
- On average, Google processes 40,000 search queries every second.
- The way people use Google is interesting. Statistics say 84% of people use Google 3+ times per day.
- In 2023, the Chrome web browser accounted for 65% of market share.
- The Google search index is over 100 million gigabytes.
- The topic-ranking search result sees a Click-Through-Rate of 22.4%.
- YouTube and Facebook were the world’s most Googled terms in 2023.
- There are nearly 15% of brand new searches on Google.
- Google’s Autocomplete feature reduces the need of typing an entire query by 25%.
- In November 2023, Google had 83.8 billion visits.
- Most Google searches are 3-4 words long.
Google Search Engine Market Share Statistics
There are a handful of search engines in the market, out of which Google strongly dominates it with an impressive 91.6% of the market share.
This makes it essential for you as a marketer not to miss out on this engine when you are looking to give your brand the right exposure.
While this is one of the Google Search Engine Market Share statistics, let us look at some more numbers.
- The Global search engine market of Google is 91.62%
- Google has a strong hold on web traffic; 66% of web traffic referrals Originated from Google in 2019.
- The official Google site receives around 277 million unique monthly visitors in the USA.
- In 2023, Google made $206 billion in AD Revenue.
- The average time for the first click is 14.6 seconds.
- Around 54% of Google’s top searches are navigational.
- 49% ask a question first to Google in case of any doubt.
- 79% of people use Google every day. That’s more than half of the overall market that uses this platform for their daily use.
- Google’s Search Engine Market Share in North America is 89.08%.
- The main site Google.com has a market share of 84.67%.
Local Google Search Statistics
Is local search SEO as important as the regular SEO?
Plainly putting it, the answer is yes, especially local Google search.
Local SEO is imperative to drive more local footfall to your store and build a loyal local customer base. If you are not sure if you should work on it, here are Local Google Search Statistics to change your mind.
- 86% of searches use Google Maps to find local businesses near them.
- 98% of searches trust reviews and read them before connecting with local businesses.
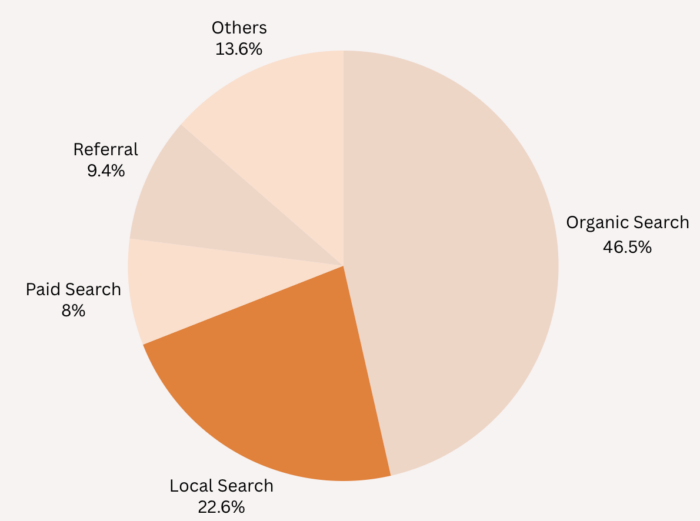
- Out of the total web traffic, local searches contribute 22.6% to it.
- Around 30% of Google mobile searches were on location.
Ecommerce Google Search Statistics
Are users only asking questions on Google or looking for products to buy as well?
Well, these Ecommerce Google Search statistics convince us that users are not just buying but also discovering new products through Google. Let’s dig more into this.
- 49% of shoppers discover new items or products through Google.
- Searchers who use search 2.4 times are more likely to buy the product.
- 68% of online shoppers look for the product on Google before making the final purchase.
- In a survey, 62% of shoppers say that the paid advertisement doesn’t change their mind about clicking, and 9% said it does impact them.
Desktop vs. Mobile Search Statistics
Knowing if your audience is coming from a desktop or mobile device makes it easy for you to put intentional efforts into optimizing the device.
These Desktop vs. Mobile Search statistics paint a clear picture of how users use Google through different devices to get their daily solutions.
- Around 60% of smartphone users contact a business directly using search results.
- 82% of the global desktop search marketing went to Google in 2023.
- In this Desktop vs Mobile search statistics battle, 25% of desktop Google searches end without any click and around 17% of mobile end without a click.
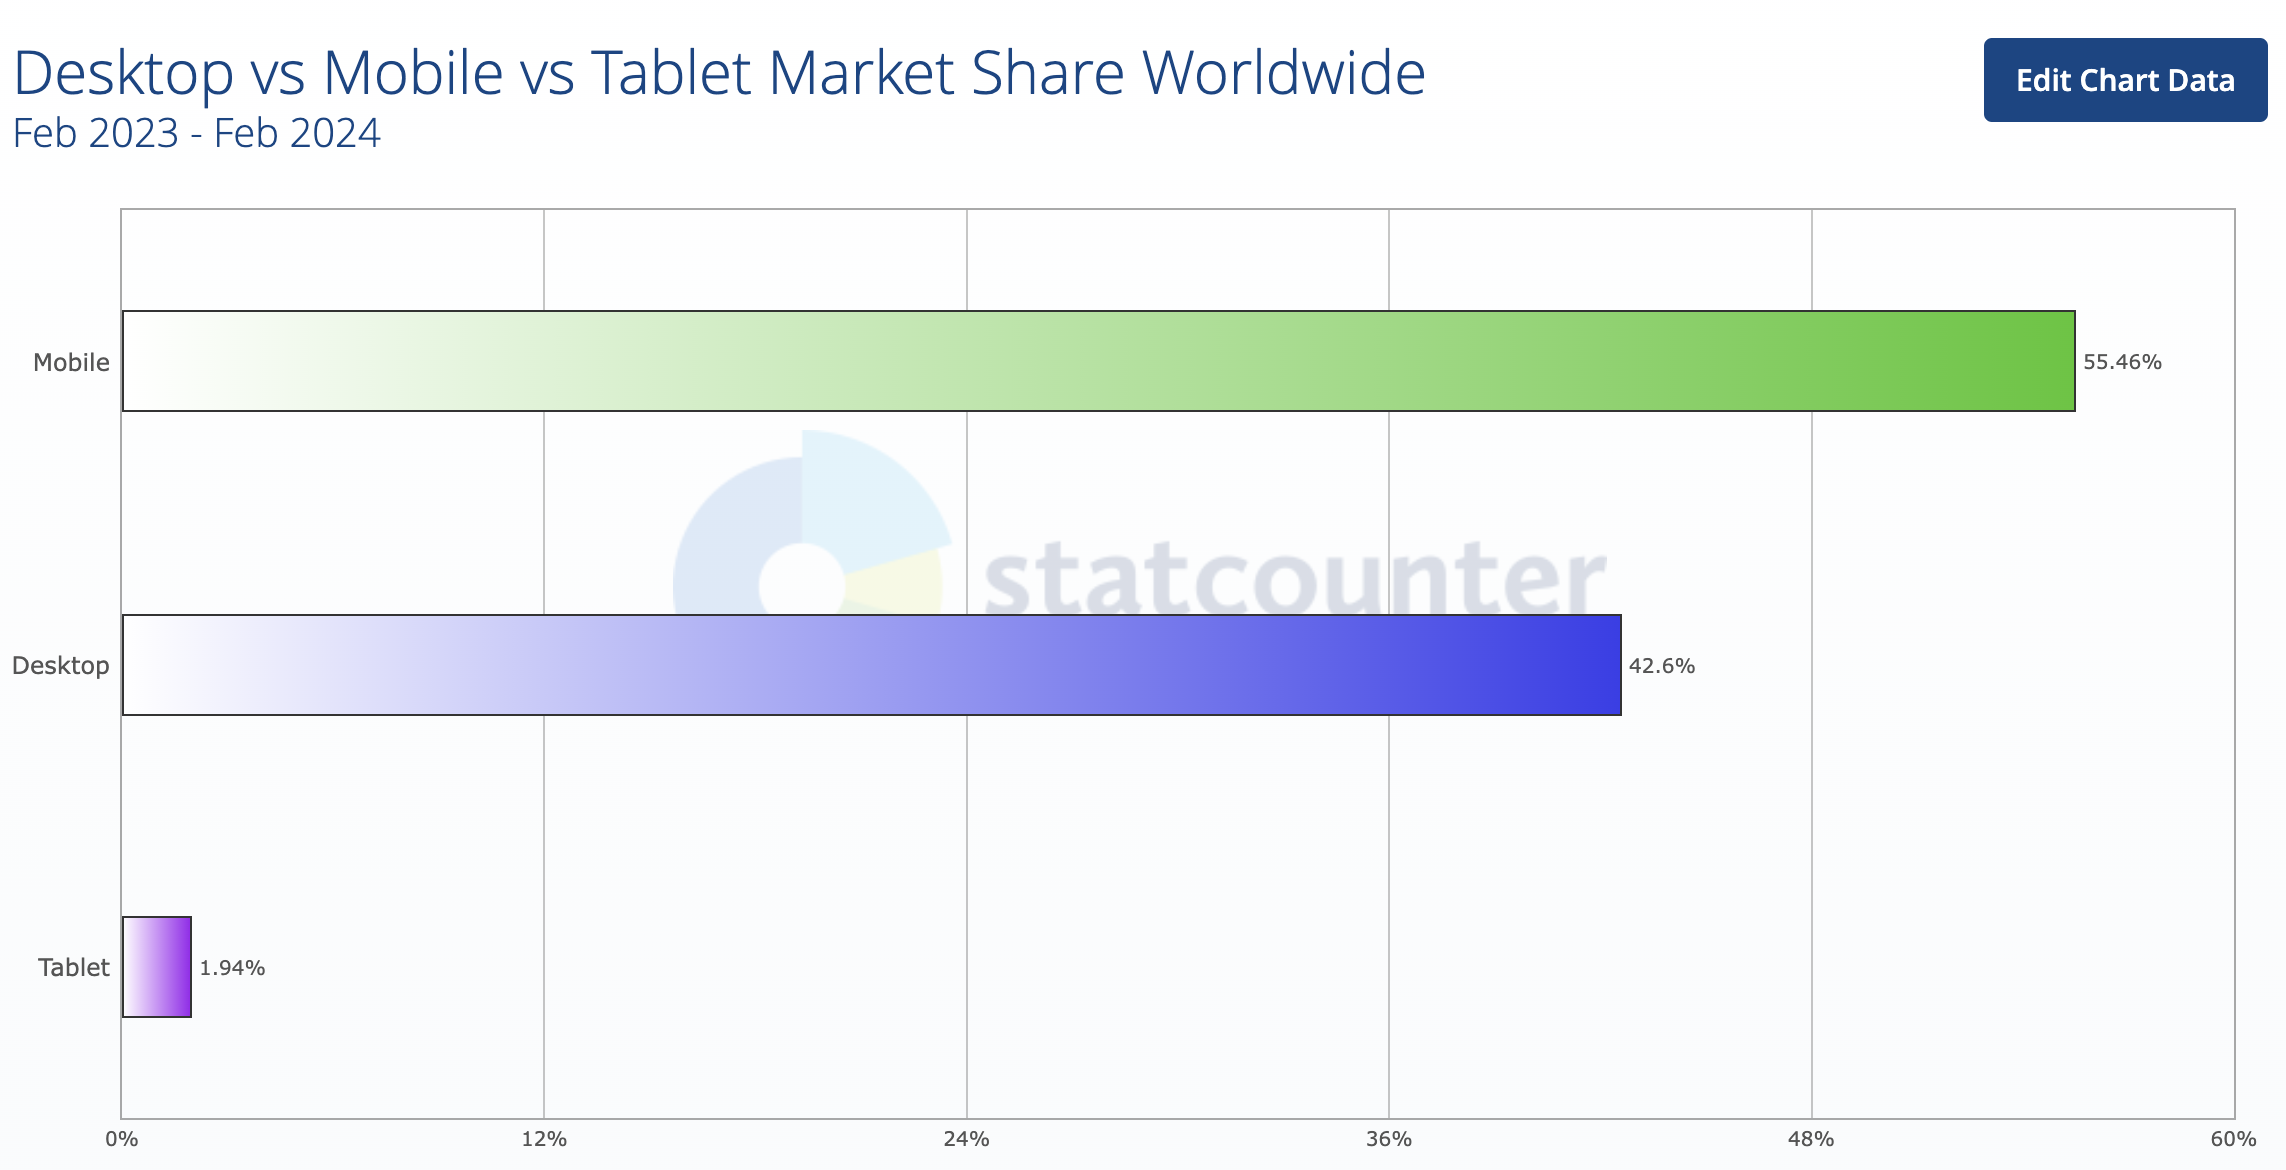
- Around 56% of web traffic searches take place on mobile devices.
- Only 1.94% of Google traffic comes from tablets.
Check Out Our: Freshly Update Mobile Marketing Statistics For 2024
Paid Search Statistics
It is not possible to talk about Google without mention of Google paid ads.
Paid ads how been a top business strategy for many businesses over the years because of the great influence they can make on direct revenue.
Let us look at them closely some paid search statistics to understand their impact.
- For one of the projects, Google Ads delivered a striking 700% ROI.
- The conversion rate for Google Ads across all industries is 7.04%.
- The most expensive Google Ads keyword costs around $200 per click.
- 63% of searchers are most likely to click on paid search ads on Google.
- 94% of searchers are likely to skip search ads.
- In contrast, 84% of brands say they see good results with their PPC campaign.
- Skipping over the paid search results, 65% of users click on organic results.
Visual Search Statistics
Have you wondered how users react to the different results that Google shows?
Besides the blue clickable links you see on the search results, Google shows images, vidoes, and other visual elements to make the search experience better.
And these visual search statistics says that the users love it, check it out.
- The Google SERPs show 18% of results as images.
- The search results show images 12.5 times more often in search results on mobile devices.
- While looking for images online, shoppers tend to click on 3D images more than static ones.
- Google Lens processes around 12 billion searches every month.
- Voice Searches queries where around weather, music, and news.
Final Thoughts
And that is a wrap for Google search statistics.
Now, you have first-hand information on how powerful this platform is and how it is growing worldwide.
If you enjoyed reading this, check out these other amazing statistics blogs by our team:
- 20+ Microsoft Bing Statistics to Know in 2024
- 10 Display Advertising Statistics Every Marketer Should Know
Source: Statista, Internet Live Stats, Statcounter, Google Search, Similarweb, Surefire, Google, Think With Google, Luisa Zhou, Power Reviews, Safari Digitals, Backlinko, Moz, Milestone, Wordstream, Search Engine Land.