SaaS (Software as a Service) has primarily become the fastest-growing business in every integral part of the industry.
Companies offer software that enhances business operations without requiring complex processes or systems. The most popular example is Shopify, which eliminates the process of creating an online store.
Similarly, millions of SaaS companies exist online. As their significance grows, knowing current SaaS statistics can provide insights into market size, growth, and popular trends.
Let’s check some SaaS statistics in this blog.
Key SaaS Statistics
- The global SaaS market is expected to grow to $1.23 trillion by 2032, achieving a compound annual growth rate (CAGR) of 18.4%.
- By 2025, it is projected that 85% of business applications will be SaaS-based.
- In 2024, around 9,100 companies providing software as a service (SaaS) operated in the United States.
- A total of 86% of enterprise buyers intend to either increase or uphold their SaaS budgets.
- By 2024, 99% of businesses are expected to use at least one SaaS application, highlighting widespread cloud adoption.
- The average annual churn rate for SaaS customers across various industries is about 5-7%.
SaaS Market Size and Growth Statistics
The SaaS market is growing rapidly as businesses find SaaS applications helpful in streamlining processes and improving efficiency.
In 2024, the expected value of the global SaaS market is $317.55 billion, and it’s projected to increase to $1,228.87 billion by 2032.
Here’s the breakdown of the growth and evolution of the SaaS market size (2020-2024):
| Year | Market Size (USD Billion) | Growth Rate (%) |
| 2020 | 178 | 13.4 |
| 2021 | 197 | 10.7 |
| 2022 | 217 | 10.2 |
| 2023 | 273.55 | 26.1 |
| 2024 | 317.55 | 16.1 |
This is some of the SaaS growth stats showing how it’s evolving, and here’s what you need to know:
- The SaaS industry has grown approximately 500% in the last seven years.
- In 2024 the estimated expenditure on SaaS applications per employee is expected to hit $92.19.
- The SaaS sector is experiencing significant growth, with a compound annual growth rate (CAGR) of 18.4% projected from 2023 to 2032.
- The United States generates the most income from the SaaS market, expecting to reach US$221.50bn in 2025.
- Spending on public clouds is predicted to increase from 17% of company IT spending in 2021 to over 45% by 2026.
SaaS Adoption Statistics
Every industry is now adopting SaaS apps to integrate into their operations, and it’s found that more than 80% of companies rely on at least one SaaS application for their operations.
Here are additional statistics that illustrate the adoption of SaaS:
- A significant 78% of small businesses have already invested in SaaS solutions.
- SaaS adoption in the healthcare industry is growing each year at an exciting rate of 20%.
- On average, larger organizations with over 10,000 employees use about 447 SaaS applications.
- The retail and e-commerce industries are expected to expand at a CAGR of 23.6%, reaching $138.9 billion by 2027.
- By 2027, the global BFSI sector is expected to attain a value of $130.7 billion, growing at a CAGR of 19.2%.
SaaS Usage Statistics
Now, you know how companies are adopting SaaS applications to improve efficiency, enhance experiences, and achieve quicker results.
But how is SaaS being used?
It’s found that 80% of businesses use at least one SaaS application, highlighting the importance of SaaS cloud software.
This is not surprising, as 70% of CIOs favor SaaS for its flexibility and scalability.
- The future looks even more cloud-focused. By the end of 2024, almost every company (99%) will be using at least one SaaS solution. Looking further ahead, experts predict that 85% of all business apps will be SaaS-based by 2025.
- This is not just a stop. Instead, companies are using more SaaS apps than ever before. The average organization went from using 80 apps in 2020 to 130 apps in 2022. This shows how businesses are quickly moving their work to the cloud.
It’s clear to see that SaaS is emerging as the standard for business software, enabling companies to work smarter and boost their efficiency!
SaaS Customer Retention and Churn Statistics
A good churn rate for SaaS companies is 3-5%, whoever is targeting small businesses.
Businesses earn 65% of their income from returning customers, who typically spend 67% more than new users.
- Keeping current customers is five times cheaper than bringing in new ones. Often, businesses earn 65% of their revenue from returning customers.
- Increasing customer retention by 5% can lead to profits rising by 25% to 95%.
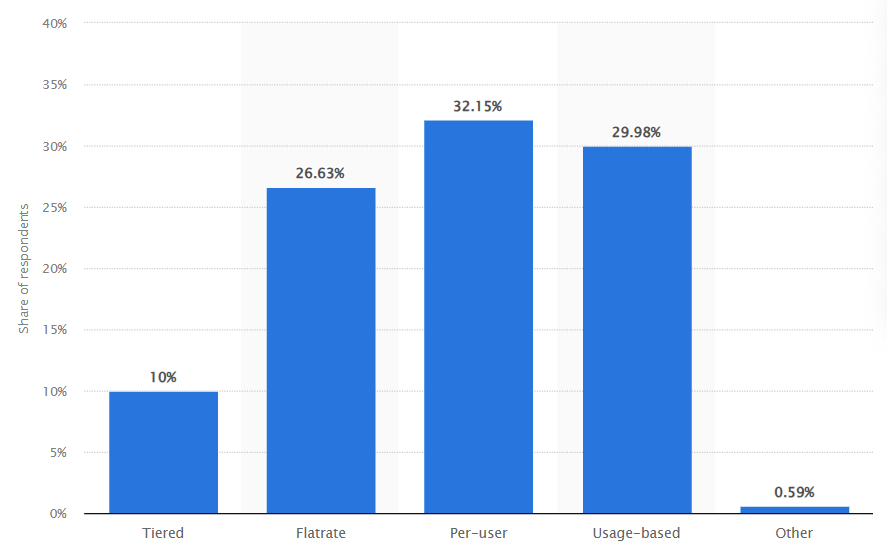
SaaS Pricing Model Statistics
SaaS pricing provides several models, with popular choices including Tiered Pricing, Flat-rate Pricing, Per-user Pricing, and Usage-based Pricing, among others.
However, per-user pricing is the most popular option among SaaS businesses, as it allows users to benefit more and reduces implementation complexity.
And here are some more exciting facts about SaaS pricing:
- Price inflation for SaaS products is 8.7%, indicating subscriptions are nearly 9% pricier than last year.
- Over 94% of B2B SaaS leaders modify their pricing and packaging each year, with nearly 40% doing so as frequently as quarterly.
- Merely 10% of SaaS companies implement a cost-plus pricing strategy, which sets prices by adding a markup to production costs.
SaaS Security and Compliance Statistics
In the last two years, 55% of organizations faced a SaaS security incident, while an additional 12% are uncertain
Over half (58%) of organizations report their SaaS security solutions cover 50% or less of applications, and 7% have no monitoring.
And here are some additional security and compliance stats you need to know:
- It’s concerning to note that 31% of respondents shared that their organizations experienced a data breach, which is a 5-point increase from last year.
- Nearly 38% expressed concerns about data risks and protecting intellectual property related to GenAI.
- Interestingly, 15% of organizations have chosen to centralize responsibility for SaaS security within their cybersecurity teams.
Regional SaaS Market Statistics
Here are the SaaS statistics by country.
| Country | No. of SaaS Companies |
| United States | 9,100 |
| United Kingdom | 1,500 |
| Canada | 992 |
| Germany | 840 |
| India | 711 |
| France | 684 |
| China | 443 |
| Australia | 408 |
| Netherlands | 402 |
| Brazil | 342 |
These are exciting stats that you need to know:
- The United States is the leading market for SaaS businesses, with 9,100 companies operating and accounting for 46% of the market.
- In 2023, the market value in North America reached $131.18 billion.
- Germany is expected to capture the largest portion of the European SaaS market.
- In 2023, the Asia Pacific SaaS market was led by China, with Japan and India following.
SaaS Marketing and Sales Statistics
B2B SaaS sales cycles averaged 69 days, a slight increase from previous years.
Typically, SaaS companies allocate roughly 15% of their yearly budget to marketing activities.
- SaaS businesses typically lose 18% of the contract value to discounts.
- SaaS marketing typically employs three key tactics: Email Marketing (84%), Social Media Advertising (75%), and Content Marketing (69%)
- Almost half of users, 47%, will look at 3 to 5 contents before contacting a sales representative.
- SaaS companies with blogs gain 67% more leads than those without.
SaaS Industry Trends
- AI and ML are increasingly essential to SaaS solutions, improving features and overall user experience.
- Remote and hybrid work models increase the demand for SaaS solutions that enhance collaboration and productivity for distributed teams.
- Low-code and no-code platforms enable non-technical teams to create applications easily and this is becoming popular as it accelerates workflows and enhances customization.
- As cyber threats rise, SaaS providers are focusing on strong security measures to safeguard user data.
Conclusion
SaaS is an indefinite topic, with many market studies, pricing structures, and, ultimately, changing trends year after year.
However, SaaS is becoming essential, and 99% of businesses use it to improve work efficiency and productivity. Many SaaS companies plan to use low-code and no-code platforms and AI integrations, making it a viable choice for almost all businesses.
So, these are the overall SaaS statistics we found significant for everyone to note.
More reads:
Sources: Fortune Business Insights, Better Cloud, Statista, Sapphire Ventures, SaaS Academy, Recurly, Exploding Topics, Gartner, BCC, SaaS Capital, Baremetrics, Demand Sage, Tech Target, Paddle, Reforge, Adaptive Shield, App Omni, Precedence Research, Honeystack, Capchase