Halloween is more than just candy and costumes—it’s a massive economic event.Consumers around the world prepare to spend billions on decorations, treats, and elaborate outfits. This year, the numbers are scarier than ever. Here are the latest Halloween statistics driving the spooky season.
Halloween Revenue & Spending Statistics
1. US $13.1 billion is the predicted total Halloween consumer spend in 2025 (U.S.).
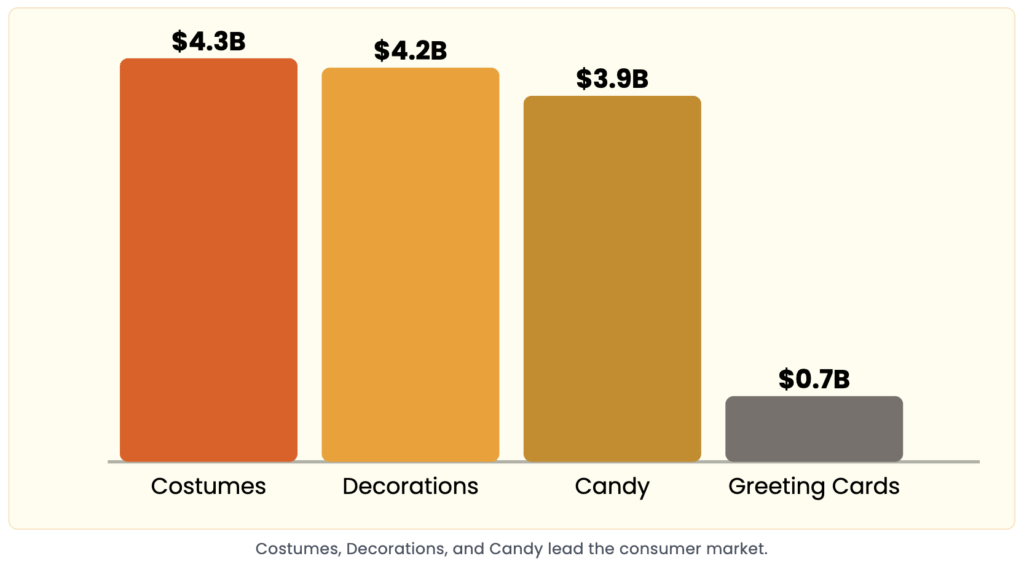
2. US $4.2 billion is expected to be spent on decorations and US $3.9 billion on candies.
3. A Canadian household spends CA $67.65 on Halloween-related expenses.
4. 72% of Canadians plan to spend approximately the same amount on Halloween as last year.
5. A US household spends $420 while per person can spend around $114.45 in this spooky season.
6. Market spending for Halloween in the UK surpassed £300 million.
Halloween Costume Statistics
7. 83% of costume material is oil-based plastic (mostly polyester).
8. UK Halloween costumes generate an estimated 2,079 tonnes of plastic waste each year
9. 40% of costumes purchased are worn only once.
10. 51% of Americans plan to wear costumes in 2025.
11. Costume spending, inclusive of both children and adults, will total $4.3 billion for the Halloween season.
- Top children’s costume choices: Spider-Man, princesses, and witches.
- Top adults’ costume choices: witches, vampires, and pirates
Online Influence & Trends During Halloween
12. In 2024, there were 4.7 million searches specifically related to Halloween costumes, movies, party ideas, candy deals, and spooky home décor.
13. 27% of sponsors and 36% of clothing brands created a dedicated Halloween landing page for Halloween 2024.
14. Walmart led online Halloween engagement, attracting over 289,000 visitors.
15. Only 13 out of 45 websites targeting Halloween achieved a top #1 ranking for their targeted keywords during the holiday window.
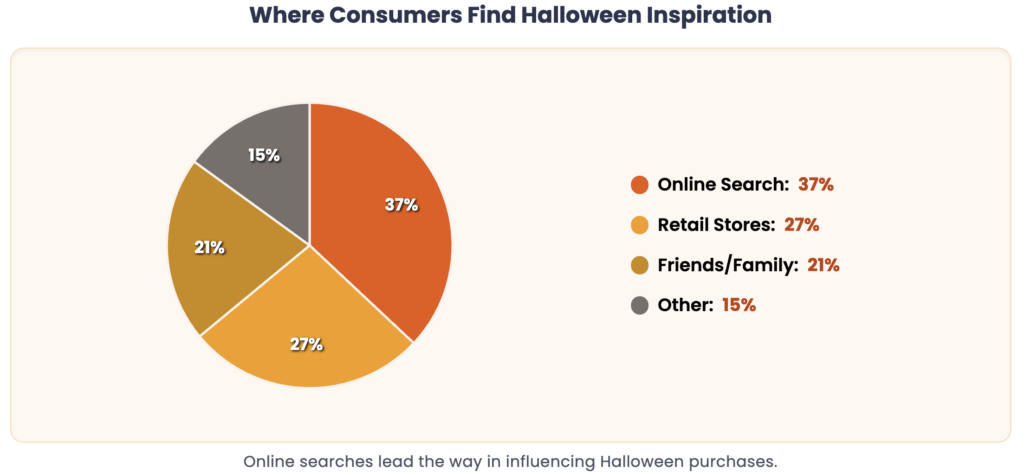
16. Online searches are the leading source of Halloween inspiration for 37% of consumers, surpassing retail stores (27%) and friends/family (21%).
17. Nearly half of consumers (49%) begin their Halloween shopping in September or earlier to avoid last-minute stress and secure desired items, reflecting a trend towards earlier online and offline purchases.
18. 31% of consumers plan to buy Halloween items online, placing online shopping on par with specialty Halloween/costume stores and just behind discount stores, which remain the top shopping destination at 42%.
Halloween Statistics: FAQs
What percentage of people celebrate Halloween?
73% of Americans plan to celebrate Halloween in 2025, consistent with 72% in 2024
How much money is spent on candy alone?
Total candy spending for Halloween is expected to reach $3.9 billion in 2025, up over 11% from $3.5 billion in 2024
What are the biggest Halloween spending categories?
- Costumes: $4.3 billion
- Decorations: $4.2 billion
- Candy: $3.9 billion
- Greeting cards: $700 million
What percentage of Halloween celebrants purchase a pumpkin specifically for carving?
Around 46% of people celebrating Halloween plan to carve a pumpkin in 2025.
Wrapping Up
The statistics prove that Halloween is a key consumer holiday, driven by massive spending on costumes and decorations, and heavily influenced by online trends and early shopping habits. Business of spooky season is bigger and more complex than ever.
Happy haunting!
More interesting reads:
- Explore Global Online Shopping Trends
- Compare with Christmas Spending Statistics
- In-depth Gift Card Statistics & Market Data
Sources: National Retail Federation, Leger, and Webspero