The Indian Unified Payment Interface, aka UPI, has changed how users prefer to pay. If it has created such an impact in the market, should you consider it for your online business?
Let these 10+ UPI statistics speak to you and let you make the judgment.
We have covered important UPI payment statistics related to daily users, transaction success rate, volume, and more, so you can make a wise decision.
General UPI Stats and Facts
- UPI was launched on 11 April 2016 by the National Payments Corporation of India (NPCI).
- UPI became one of the fastest-growing payment solutions because of its simplicity and convenience.
- Unified Payments Interface can be used in 7 countries: Sri Lanka, Mauritius, UAE, Singapore, Bhutan, and Nepal.
- NPCI launched UPI 2.0 in August 2018 with features like signed intent & QR, one-time mandates, invoice verification, and overdraft facilities.
- A merchant has to pay 1.1% of the transaction amount above Rs. 2000.
UPI Performance and Growth in 2025
In August 2025, UPI processed over 20 billion transactions worth more than ₹24.85 lakh crore, reinforcing its role as India’s primary digital payment system.
June 2025 saw 18.39 billion UPI transactions, totaling₹24.03 lakh crore. In the first half of 2025 (Jan–Jun), UPI processed 106.36 billion transactions worth ₹143.35 lakh crore
The average ticket size dropped to ₹1,348, highlighting increased usage of UPI for low-value, everyday payments
Person-to-Merchant (P2M) payments reached 67.01 billion transactions in H1 2025, growing 37% YoY, driven by wider merchant adoption
QR codes expanded to 678 million, PoS terminals reached 11.2 million, supported by 4.74 lakh 5G base stations, 116 crore mobile subscribers, and low data costs of ₹9.34/GB.
UPI is live in the UAE, Singapore, Bhutan, Nepal, Sri Lanka, France, and Mauritius, enabling cross-border digital payments.
NPCI revised P2M transaction limits from September 15, 2025, while PwC projects 1 billion daily UPI transactions by FY27 and 90% digital share in retail payments
UPI Performance Comparison: 2024 vs. 2025
| Metric | 2024 (Approx.) | 2025(Approx.) |
| Transactions | 117.6 billion | 228.3 billion |
| Value | 247 lakh crore | 299.7 lakh crore |
| Avg Daily | 322 million | 698 million |
| Avg Ticket Size | ₹1,478 | ₹1,293 |
UPI grew due to more merchants accepting it, holiday spending spikes like December 2025’s ₹21.63 billion transactions, and new features like credit-on-UPI. The growth kept up, with monthly peaks like November 2025 at over ₹19 billion transactions, up 23% from the year before, and the daily average transaction was ₹698 million in 2025.
Total volume reached 228.3 billion transactions with a value of Rs 299.7 lakh crore in 2025 (up from 172.2 billion in 2024. Year-on-year growth:29.3% in volume, 20.3% in value
Daily average transactions reached 698 million. Average ticket size: Rs 1,293 (down from Rs 1,600+ in early 2023), driven by routine small purchases like groceries (2.5x growth in 2 years) and cigarette shops (8x jump).
UPI transaction volumes grew 32.5% YoY from 2024 to 2025, outpacing value growth of 21.6%, due to rising small-ticket retail usage
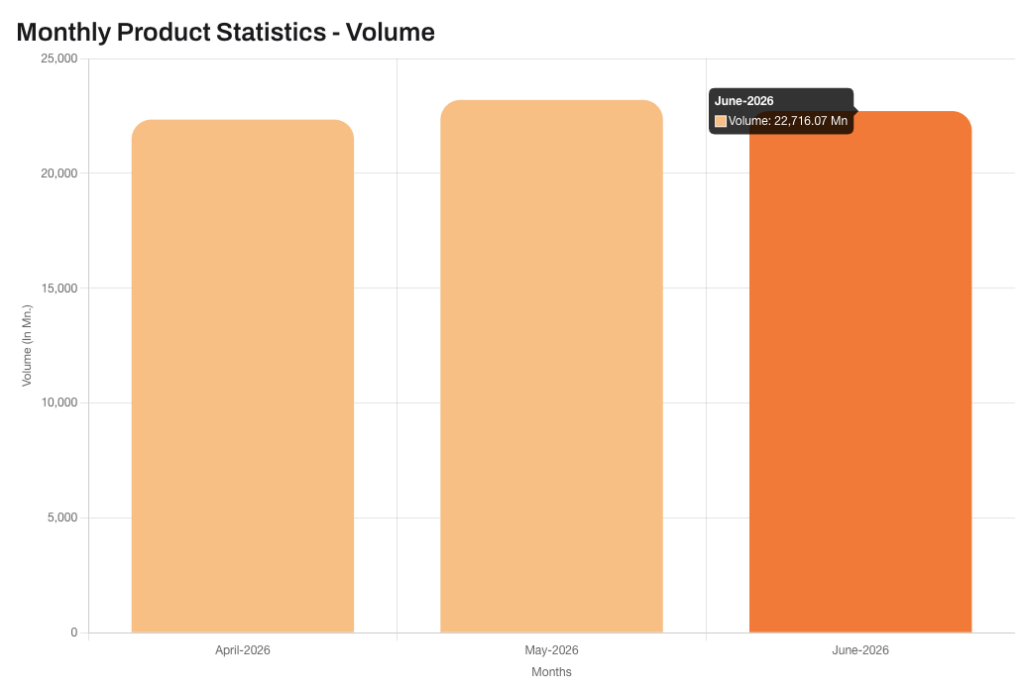
UPI Transaction Volume & Value Statistics: June 2026
In June 2026, UPI volume decreased to 22,716.07 million, a 2.09% decline compared to 23,201.93 million in May 2026.
If you are wondering how many UPI transactions are happening per month? Then, the NPCI UPI statistics claim the transaction volume for June 2026 is 22,716.07 million.
The NPCI also shared a clear breakdown of P2P & P2M transactions (June)
| P2P Volume | P2P Value | P2M Volume | P2M Value |
| 8,288.19 mn | 19,11,812.35 cr | 14,427.88 mn | 8,60,997.14 cr |
This indicates that more shoppers prefer using UPI to complete their payment, highlighting its growth and adoption among merchants and customers. While the ticket size for both P2P and P2M transactions went beyond ₹2000.
86% of the transaction range fell between ₹0-₹500.
The daily UPI transaction value in June 2026 was recorded at ₹28.92 lakh crore.
The total value saw an increase of 6.03% in January 2026, which coincided with a slight volume growth. Below is the monthly breakdown, including the growth percentage.
| Monthly | UPI Daily Transactions Value | Monthly Growth |
| Jun ‘26 | ₹28.92 lakh crore | -3.28% |
| May ‘26 | ₹29.90 lakh crore | 3.00% |
| Apr ‘26 | ₹29.03 lakh crore | -1.69% |
| Mar ‘26 | ₹29.53 lakh crore | 10.02% |
| Feb ‘26 | ₹26.84 lakh crore | -6.03% |
| Jan ‘26 | ₹28.33 lakh crore | 0.32% |
| Dec ‘25 | ₹26.32 lakh crore | 0.04% |
| Nov ‘25 | ₹26,31 lakh crore | -3.52% |
| Oct ‘25 | ₹27,27 lakh crore | 14.24% |
| Sept ‘25 | ₹23.87 lakh crore | -0.20% |
| August ‘25 | ₹24.85 lakh crore | -0.92% |
| July ‘25 | ₹25.08 lakh crore | 4.37% |
| June ‘25 | ₹24.03 lakh crore | -4.43% |
| May ‘25 | ₹25.14 lakh crore | 4.97% |
| April ‘25 | ₹23.95 lakh crore | -3.32% |
| March ‘25 | ₹79,903 crore | 12.78% |
| February ‘25 | ₹78,417 crore | -6.90% |
| January ‘25 | ₹23.48 crore |
NPCI UPI Statistics: Bank-wise & Top Apps in India
PhonePe, Google Pay, & Paytm are the top processors of UPI Payments
PhonePe, Google Pay, and Paytm are the apps users prefer to complete a UPI transaction. These apps together process 87.93% of the UPI payment volume, and PhonePe remains the top UPI app.
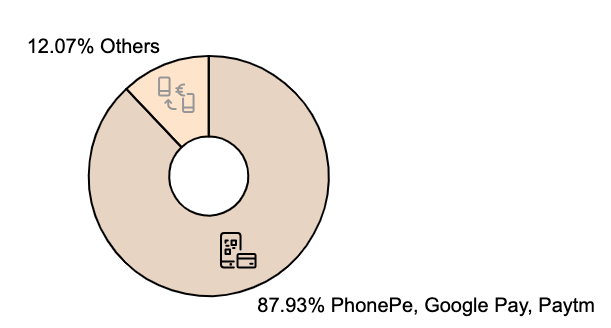
PhonePe processed 10,483.73 million UPI transactions, followed by Google Pay with 7,407.71 million.
Axis Bank & Yes Bank of India are the top Payment Service Providers for UPI transactions
As per NPCI reports for November, the top PSPs with the most UPI transactions were Axis Bank and Yes Bank.
Axis Bank accounted for 9,349.49 million transactions, followed by Yes Bank with 8,185.24 million transactions. As of June 2026, the number of banks live on UPI in India has reached 731.
Maharashtra is the highest state with the maximum UPI usage.
Comparing the UPI state-wise statistics based on how much each state contributes in volume and value. Maharashtra has the highest share, followed by Karnataka, Uttar Pradesh, Telangana, and Tamil Nadu.
Here are the top 5 states with the maximum UPI usage (June 2026).
| States | Volume in millions | Volume contribution (%) | Value in crores | Value contribution (%) |
| Maharashtra | 2,221.42 | 9.78% | 2,67,412 | 9.25% |
| Uttar Pradesh | 1,221.70 | 5.38% | 1,53,254 | 5.30% |
| Karnataka | 1,175.34 | 5.17% | 1,66,247 | 5.75% |
| Telangana | 900.79 | 3.97% | 3.97% | 5.11% |
| Tamil Nadu | 908.74 | 4.00% | 1,41,792 | 4.90% |
The average ticket size in India using UPI is ₹1.348 in 2025
The UPI ticket size has ranged from Rs. 1250 to Rs. 1528; the ticket size peaked after 2022 as digitalization peaked post-COVID.
- The average ticket size for person-2-person transactions increased from Rs 2,812 to Rs 2,836.
- The average ticket size for person-2-merchant transactions dropped from Rs 667 to Rs 643
However, the average ticket size saw a decrease of 8%. P2M transactions reached 62.40% in August 2024, where 85% of these transactions were up to ₹500.
Here is a merchant category-wise distribution of UPI usage.
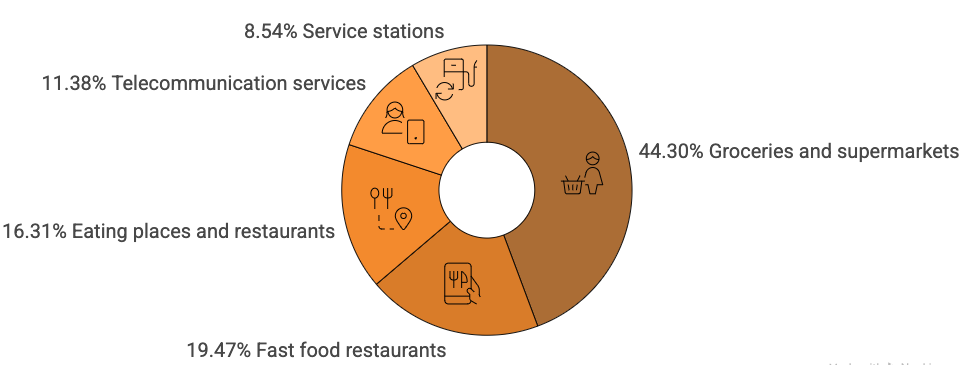
In June 2026, the total merchant stats for this category recorded a volume of 14,427.88 million transactions, with a total value of 8,60,997.14 crore.
The highest category transaction was with the value of 79,705.02 crores for groceries and supermarkets, followed by 17,418.12 crores for fast food restaurants.
UPI Predictions for 2026: What to Expect
UPI value projected at ₹532 lakh crore ($6.4 trillion) by 2029, building on 2025 highs toward multi-trillion annual volumes in 2026. This supports India’s digital economy shift, with UPI dominating 90% of retail flows.
- Growth will be driven by faster transactions, global expansion, and increased daily spending, supported by new tech and government rules
- By FY2026-27, UPI transactions are expected to hit about 379 billion annually, making up roughly 90% of retail digital payments
- NPCI plans to expand UPI’s reach to over different countries by 2026, focusing on East Asia and the Gulf
- UPI aims for global payment standard status, driven by cross-border QR payments and RuPay technology
Frequently Asked Questions
1. Which is the no. 1 UPI app in India?
PhonePe is one of the most used UPI apps in India.
2. What is the success rate of UPI?
The success rate of UPI transactions is 99.2%
3. What is the number of UPI users in India in 2026?
As of 2026, there are 554.0 million users and over 65 million merchants.
Wrapping Up
These UPI stats clearly show how much users have started to trust UPI for online payments and the growing familiarity in the market.
UPI continues to evolve positively. These UPI statistics look promising and have the potential to take over other payment options because of their seamless processing.
We hope these statistics helped you to know UPI a little better.
Sources: NPCI.org, Financial Express, LiveMint, PWC, inc42, Statista