Search engine marketing is now the easiest for store owners to attract shoppers, generate leads, and convert them into loyal customers.
SEM allows brands to cut through the noise organically or via paid efforts to reach the interested shoppers.
And now with AI coming into the game, search engine marketing can’t be ignored. In this blog, we have covered some very interesting search engine marketing statistics that will encourage you to start your SEM as soon as possible.
Search Engine Marketing Statistics: Editor’s Favourite
- Google holds 89.62% market share in the global search engine industry.
- Ad spending worldwide has reached $351 billion in 2025.
- US click-and-collect ecommerce sales grew to $58.52 billion
- Average ad spending per internet user is estimated to be US$58.21 in 2025
- 61% of the total ad spending is expected to come from them by 2029
- Google & Amazon generated an advertising revenue of $660 billion worldwide.
- In 2025, their ad revenue is forecast to amount to 715 billion dollars.
Paid Search Trends in Search Engine Marketing
Paid search means brands pay to show their ads when people search for certain words related to their brand online.
These ads appear on platforms like Google, Amazon, Bing, Meta, LinkedIn, and TikTok, with Google dominating the market with 50.5% of total search ad spending in 2025.
Let’s see some more interesting search engine usage statistics worldwide.
- Average cost-per-click (CPC) for Google Ads is around $1.16
- Google’s ad revenue amounted to $264.59 billion in 2024
- Microsoft generated $12 billion in advertising revenue IN 2022
- In 2021, 29% of paid Microsoft ad clicks originated from smartphones
- In December 2024, the average monthly Google Ads CPC for the U.S. marketing and advertising sector was $7.66, one of the highest globally
- The USA is expected to spend $154.78 billion on ads in 2025
- Brands that add online reviews to their Google Shopping Ads see up to a 24% increase in CTR
Conversion Rates & ROI in Ecommerce SEM
Conversion rate measures the percentage of website visitors who complete a desired action, most often, making a purchase. In search engine marketing, it’s a vital indicator of how well your strategies are performing.
- Most Ecommerce sites have a conversion rate between 2% and 3%.
- Shopify stores average around 1.4%, but top 10% performers can reach 4.7%.
- Average conversion rate for all industries is 3.75% for search & 0.77% for display.
The conversion rate differs from industry to industry. Here is a table to understand the standard conversion rate between different platforms.
| Industry | Conversion Rate |
| IT & software companies | 1.5% |
| Beauty & skincare | 3% |
| Food & beverage | 2.5% |
- Great Britain had a higher conversion rate (2.4%) compared to the United States & other global regions
- On the other hand, the cart abandonment rate has risen to 70%.
In the USA, the reason why people leave the cart is because of costs like:
- Shipping charges
- Taxes
- Service fees
- & more tax
Another important element for your analysis is Return on Investment (ROI) to measure how much profit you earn compared to what you spend on SEM.
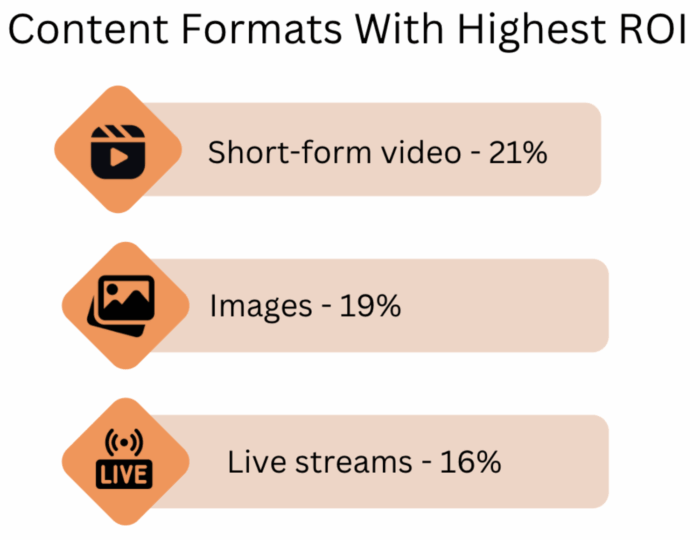
- Content formats that deliver the highest ROI are short-form video (21%), images (19%), and live streamed videos (16%)
- 46% of weekly podcast listeners have purchased a product or service after hearing about it on a podcast.
- Platform with the highest ROI are Facebook (28%), Instagram (22%), and YouTube (12%)
- Brands most commonly spend 50-74% of their marketing budget on influencers or content creators
Mobile and Social Commerce: Search Marketing
Mobile Commerce (m-commerce) and Search Engine Marketing (SEM) are deeply interconnected, as mobile devices have become the primary channel through which consumers discover, research, and purchase products.
Search Engine Marketing is more mobile-centric than ever.
You can tailor your SEM strategies for mobile-first behavior involving using mobile-specific ad formats like click-to-call, location extensions, and app promotion ads.
- Revenue from mobile e-commerce sales reached $1.7 trillion in 2023
- Smartphones constituted 77% of retail site traffic globally, generating 68% of online orders
- Mobile Ad spending is expected to show an annual growth rate of 8.86%, resulting in a projected market volume of $483.50 billion by 2029.
Cost per Click (CPC) & Ad Spend Statistics
Cost Per Click (CPC) is a pricing model used in digital advertising where you pay a fee each time a user clicks on their ad. The cost varies depending on factors like keyword competition, industry, user location, and device type.
Here is the average top 5 Cost-Per-Click rates by industry for Google Ads in 2024.
| Business category | Avg. CPC |
| Attorneys & Legal Services | $8.94 |
| Business Services | $5.37 |
| Dentists & Dental Services | $6.82 |
| Home & Home Improvement | $6.96 |
| Industrial & Commercial | $4.95 |
- Worldwide total media ad spending will cross the $1 trillion threshold this year.
- 10 parent companies will have at least $10 billion in digital ad revenues worldwide in 2025.
Consumer Search Behavior and Purchase Decisions
In the context of search engine marketing, understanding customer behavior is crucial to guiding users along their path to purchase. Consumers today begin their buying journey by typing queries into search engines, often looking for information, comparisons, or reviews before making a decision.
These search patterns reveal user intent which can be used in your SEM strategy.
By aligning keywords, ad copy, and landing pages with what users are actively seeking, SEM helps brands become visible at critical decision-making moments, ultimately influencing purchasing outcomes.
- 66.6% of U.S. consumers now use social platforms for product search
- Nearly half of U.S. social media users made at least one purchase via a social channel in 2023
- 57% of shoppers identify marketplaces like Amazon as their primary avenue for finding new products, surpassing traditional retail sources
Wrapping Up
As the digital landscape evolves, Search Engine Marketing remains one of the most effective ways for brands to connect with high-intent consumers.
Crafting a successful SEM strategy in 2026 requires more than just running ads—it demands a data-driven approach that aligns with user behavior, device preferences, and evolving platform trends.
Ultimately, the key to winning in SEM lies in continuous optimization, audience understanding, and a clear focus on delivering value at every stage of the search journey.
Sources: eMarketer, Statista, Yotpo, Forrester, Littledata, WordStream, HubSpot, Edison Research, Accenture, and Salsify