We depend on our smartphones for everything now — especially apps.
If you’re planning to launch an app, already have one, or simply want to understand the market better, this article is tailored for you.
Explore some very interesting mobile app statistics here and understand the future market of mobile apps.
Key Mobile App Download Statistics
Mobile apps are at the heart of the digital revolution, with billions of downloads each year highlighting their growing importance in everyday life.
- 97% of the apps are free, underscoring their accessibility to a broad audience.
- Free Android apps account for 97%, with paid apps making up 3%.
- In Q2 2025, global consumer spending on mobile apps reached a staggering $40 billion.
- By Q3 2023, the average consumer spending per smartphone stood at $5.05.
- The mobile eCommerce market is projected to reach $3.35 trillion by 2028.
Mobile App Usage Stats
While users download numerous apps, only a handful become part of their daily routine.
The average smartphone user has 80 apps installed, but they use only 9 apps daily and revisit 30 apps monthly.
- Users spend an average of 4 hours and 37 minutes daily on mobile apps.
- The monthly time spent on mobile apps in 2024 was 1.12 trillion which grew by 13.01% from 2023.
- A significant 62.30% of this time is dedicated to communication, entertainment, shopping, and social media apps.
- Mobile devices drive nearly 64 percent of visits and 59 percent of orders.
- 47% of users recall app ads, compared to 46% for mobile web ads and 36% for desktop ads.
- Apps using mobile ad networks for monetization are expected to grow by 60%.
Mobile advertising remains a powerful tool for user attention and monetization. Businesses that invest in well-targeted ad campaigns can significantly boost their app’s visibility and revenue potential.
Despite their popularity, apps face significant retention challenges, with many users uninstalling them shortly after installation.
56% of mobile apps are uninstalled within 7 days due to:
- Large memory space requirements (50.6%).
- Complex registration processes.
- Privacy and security concerns (29.6%).
- Persistent notifications (71%).
- Performance issues (62%).
On average, an app loses 77% of its daily active users (DAUs) over time. This indicates that businesses should invest in the development of Progressive Web Apps (PWAs) and Lite versions to address app size concerns and enhance retention.
Mobile App Download Statistics by Country
China leads the global app download market, recording 113 billion downloads in 2023.India follows with 26 billion downloads, reflecting the country’s growing digital economy.
Here are the top 5 countries with highest mobile app usage.
| Countries | Mobile app downloads (in billions) |
| India | 75 |
| China | 62 |
| USA | 35 |
| Brazil | 28 |
| Indonesia | 18 |
Across all markets, the time spent on mobile apps rises annually.
Countries like India and Italy saw a 30% growth in the average time spent using apps between 2019 and 2020.
Top Mobile App Categories and Trends
The gaming category continues to rule the mobile app market, maintaining its position as the most downloaded category globally.
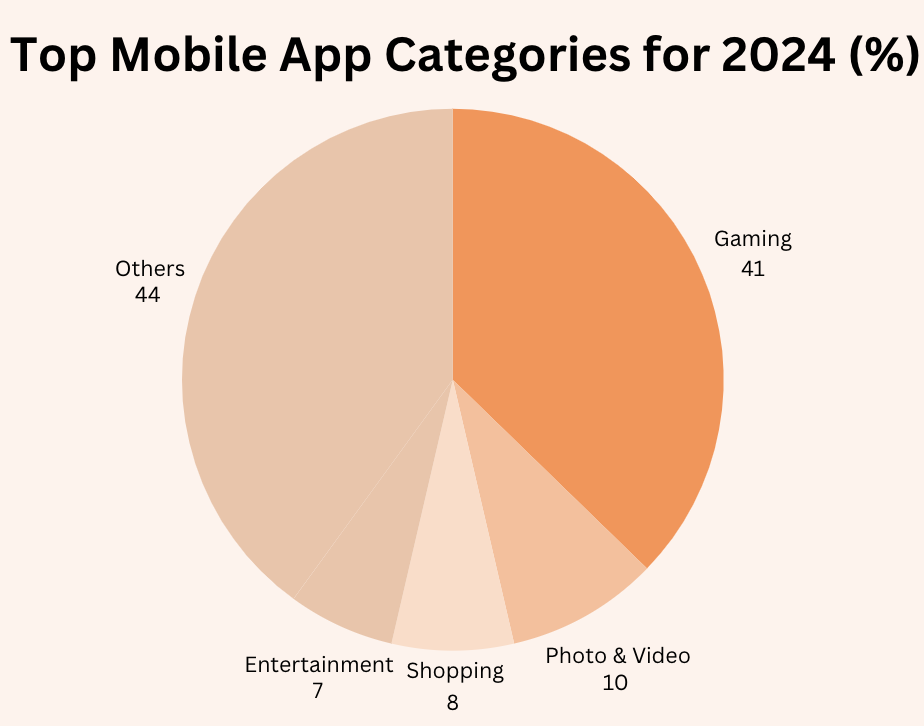
- Between 2023 and 2024, games accounted for over 49% of all app downloads worldwide. Followed by photo and video apps ranked second, representing 10% of all downloads.
- Categories like business and music apps captured a smaller but notable market share, contributing 4% each of global downloads.
Apple App Store vs. Google Play Store: A Comparative Analysis
Regarding downloading mobile apps, the Apple App Store and Google Play Store dominate the market, serving as the primary platforms for iOS and Android users respectively.
Here’s how these two giants stack up against each other:
Google Play continues to lead in app installs, outpacing the Apple App Store by a significant margin.
- Google Play witnessed 299 billion new app installs in 2025, marking a 8% year-over-year increase from 277 billion installs in 2024.
- On average, 74% of downloads in the Top 10 countries originate from the Google Play Store.
Conversely, the Apple App Store recorded fewer installs, with its numbers dwarfed by Google Play’s dominance in the Android market.
- In countries like India, Indonesia, Brazil, and Mexico, 90% of downloads are from the Google Play Store, highlighting Android’s dominance.
- Conversely, in the United States, the Apple App Store leads with 63% of downloads, though Google Play Store captures a growing 40% share.
Wrapping It Up
The mobile app landscape is evolving rapidly, with app downloads and usage growing consistently across all major markets.
Whether targeting high-download countries like China and India or leveraging platform-specific preferences, aligning your e-commerce goals with mobile app trends is crucial for success.
If you’re a Magento store owner looking to join the mobile revolution, Meetanshi’s Magento 2 Mobile App Builder offers an easy, no-code solution to deploy fully functional Android and iOS apps.
Sources: Statista, Sensor Tower, Tech Crunch, App Tweak