As we examine the latest Ecommerce statistics, one thing is clear: the global ecommerce landscape continues to expand at an unprecedented pace.
This article brings together the most impactful statistics on ecommerce growth, covering B2B and mobile commerce, traffic trends, and the current ecommerce growth rate.
Let’s break down the numbers that will define ecommerce in 2025!
General Ecommerce Statistics
Let’s kick off with some core statistics highlighting global Ecommerce growth rates. These insights clearly show the industry’s trajectory and what businesses can expect in the coming years.
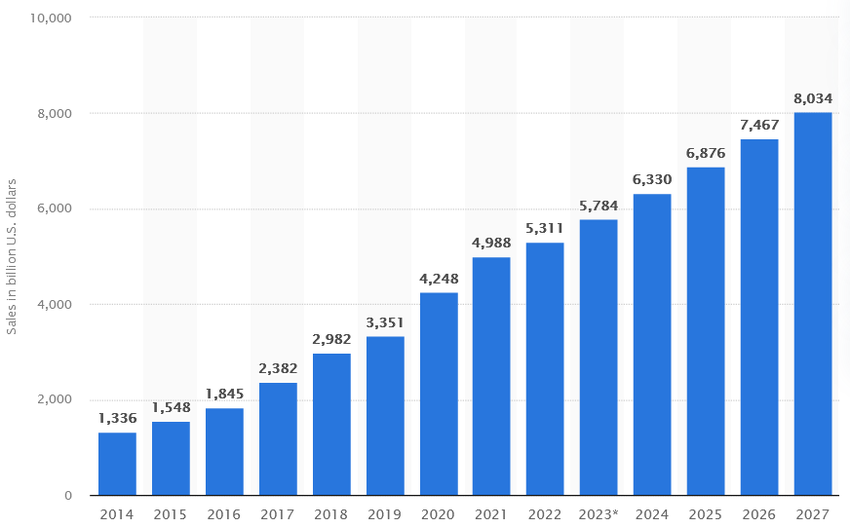
- Global retail e-commerce sales hit around $5.8 trillion in 2023. It is projected to grow by 39% over the next few years, potentially exceeding $8 trillion by 2027.
- As of 2024, the global count of online shoppers reached 2.71 billion, reflecting a 2.7% year-over-year increase. Projected to raise to 2.77 billion by 2025.
- In the U.S., more than three-quarters of the population now shops online. The retail Ecommerce sales are forecasted to grow by nearly 9% between 2024 and 2029.
- In 2023, global retail e-commerce sales were estimated at over $5.7 trillion, with an anticipated 39% increase, pushing them past $8 trillion by 2027.
- The use of electronics led the global e-commerce market to generate $988.4 billion, surpassing the fashion industry, which generated $904.5 billion.
- Food and beverage Ecommerce also saw rapid growth, boasting a 35% revenue increase.
- China is responsible for over $3 trillion in annual e-commerce sales. The U.S. ranks next, contributing over $1 trillion annually—about a third of China’s total.
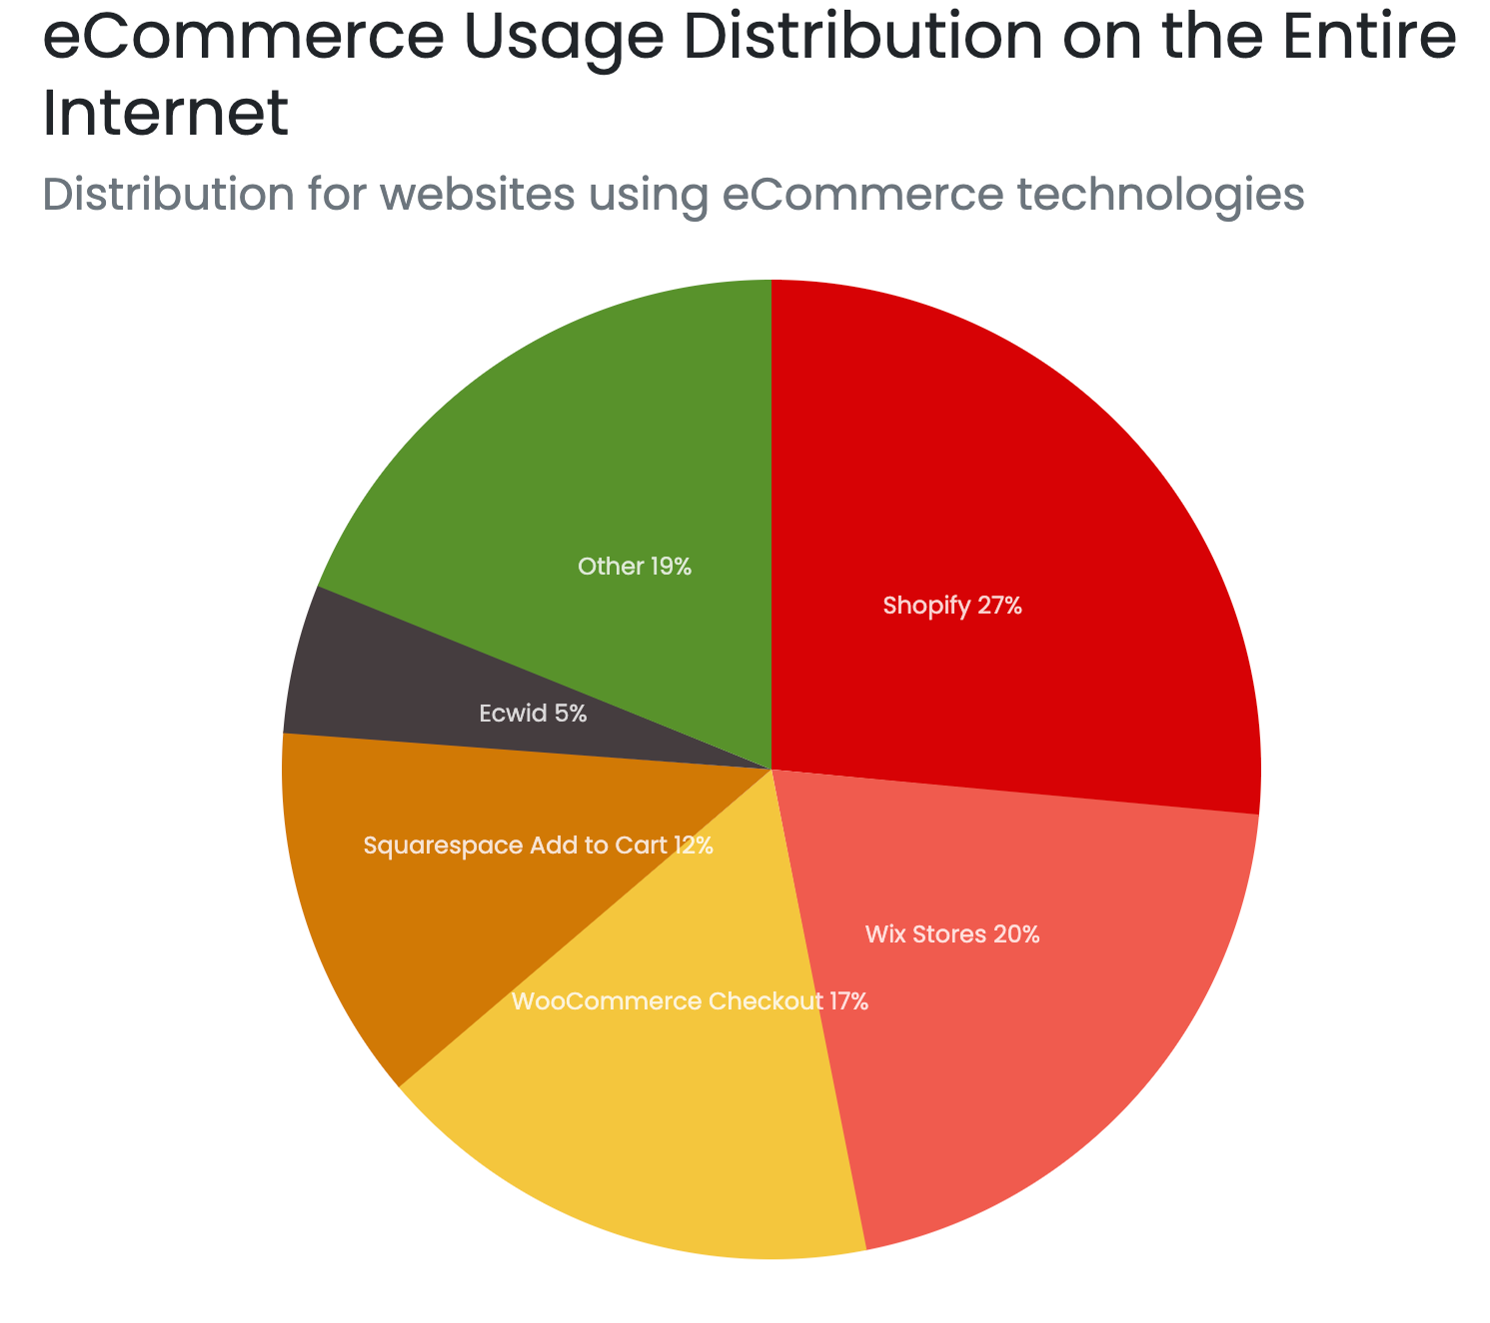
- As of September 2023, there were approximately 27 million e-commerce stores online, with 27% of these retailers hosted on Shopify.
Online Shopping Behavior Statistics
Next, let’s dive into key insights about online shoppers. “What motivates them to make online purchases?” or “What causes them to abandon their carts?”
Understanding these behaviors is essential for tailoring strategies that boost engagement and conversion.
- An impressive 93% of online shoppers expect a better experience when using eCommerce sites or mobile apps compared to shopping in physical stores.
- The primary drivers for online shopping are lower prices (29%), convenience (21%), free shipping (14%), product availability (7%), and high-quality customer service (7%).
- 70.19% of online shoppers leave the car without completing a purchase.
- 79% of companies report that offering live chat positively impacts sales, revenue, and customer loyalty.
- 51% will make repeat purchases if live chat support is available.
Ecommerce Marketing Statistics
Crafting impactful marketing campaigns is essential for staying competitive in the fast-paced Ecommerce landscape.
The following marketing statistics reveal key digital trends, guiding optimizing ads and strategies to drive higher conversions and maintain relevance.
- 84% of consumers say they’re more likely to stick with a brand that offers a customer loyalty program.
- A loyalty program member spends between 12-18% more per year than non-loyalty program members.
- 75% of consumers rely heavily on visuals when making purchase decisions. High-resolution photos build trust.
- 75% of shoppers favor brands that tailor their online experience.
- 61% of high-growth businesses prioritize this data-driven approach.
Analytics tools like Google Analytics provide valuable insights, enabling Ecommerce brands to understand customer behavior and improve personalization efforts.
Mobile Ecommerce Statistics
Mobile commerce opens up exciting possibilities for Ecommerce brands to enhance visibility and build stronger connections with their audience.
- Mobile devices generate 54.67% of global website traffic, so having a mobile-optimized site is crucial.
- Mobile search results see an 85% higher click-through rate compared to desktop.
- 60% of smartphone users reach out to local businesses directly from search, and 51% discover new brands or products while browsing on their mobile devices.
- In 2023, mCommerce sales in the U.S. exceeded $491 billion, with projections indicating a near doubling to around $856 billion by 2027.
- Mobile shopping is most popular among 18 to 34-year-olds, with many preferring smartphones over tablets.
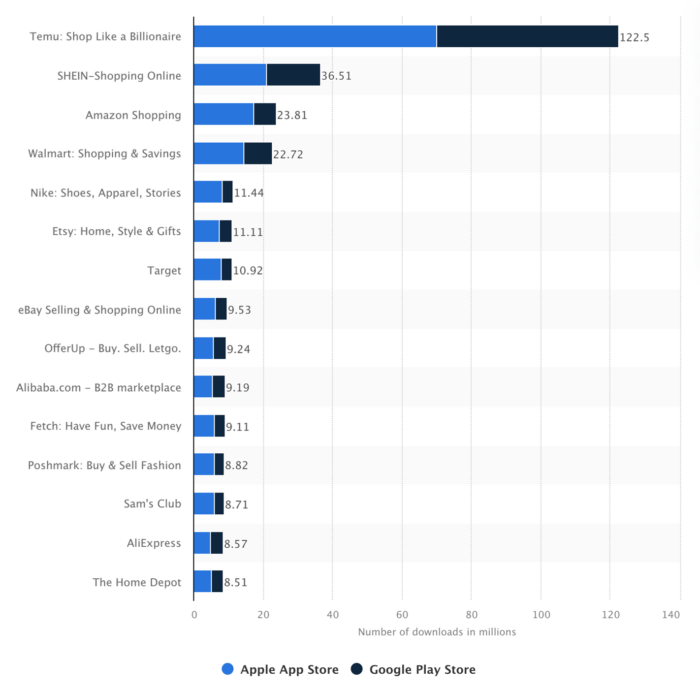
- Temu topped U.S. downloads across both iOS and Android, with over 122 million downloads. Fast-fashion giant SHEIN followed, securing nearly 21 million downloads on iOS and over 15 million on Android.
- As of March 2023, the largest group of mobile shoppers in the U.S. came from households earning under $25,000, comprising 34.9% of mCommerce users.
- The second-largest group, at 17.7%, had household incomes between $40,000 and $59,999.
Time to Grow Your Business
The Ecommerce landscape is evolving at breakneck speed, with mobile commerce, video marketing, and customer-focused experiences.
By aligning strategies with these data-backed insights, you can anticipate customer needs, improve online engagement, and stay competitive in a crowded marketplace.
As we move into 2025, keeping up with these trends will empower you to make well-informed decisions that drive both immediate and sustained growth.
Source: Statistica, Emarketer, Data Reportal, MobiLoud, BuiltWith, Coveo, Feedvisor, Baymard, Zinrelo, Innovative, Exploring topics