After trying a lot of strategies, you’re still not making as many sales as expected.
The problem here could be cart abandonment.
You’ve invested in marketing, but customers aren’t engaging and are leaving their carts behind. Thus, understanding your customers is crucial to improving your sales.
For this, we’ve found 35+ cart abandonment statistics that you shouldn’t ignore if you want to increase sales and revenue with your marketing efforts.
Cart Abandonment Statistics – Top Picks
Cart abandonment is a major issue for most e-commerce businesses, but knowing the key statistics can help you optimize your strategy and increase sales.
Here are some of the key highlights we’ve found on cart abandonment rate statistics.
| Pointers | Statistics |
| Global Cart Abandonment Rate | 70.19% (for 2024) |
| Cart Abandonment Rate for Mobile Devices | 80.2% |
| Cart Abandonment Rate for Desktop Devices | 70% |
| Shopping Cart Abandonment During Checkout Process | 22% |
| Cart Abandonment Recovery Rate | 29.9% (via Emails) |
| Highest Cart Abandonment by Industry | 98% (Cruise & Ferry) |
| A Most prominent reason for cart abandonment | 48% (Due to Extra Costs) |
Key Cart Abandonment Statistics
- On average, the global cart abandonment rate stands at 70.19%, meaning nearly 7 out of 10 consumers abandon their online shopping carts before completing a purchase. In March 2020, 88.05% of online shopping orders were abandoned.
- Mobile devices lead in cart abandonment, with a rate of 80.2%, compared to 70% on desktop devices. This highlights the need to improve mobile shopping experiences.
- The Cruise & Ferry industry has the highest abandonment rate at 98%, indicating that some sectors face more significant challenges in reducing cart abandonment.
- 22% of cart abandonment occurs because consumers face a long or complicated checkout process. Simplifying this process could help reduce abandonment rates.
- The most common reason for cart abandonment is extra costs such as shipping, taxes, and fees, contributing to 48% of abandoned carts.
- Email recovery is the most effective method for recovering abandoned carts, with an improvement rate of 29.9% when used as part of a cart recovery strategy.
Cart Abandonment Statistics by Industry
- The cruise & Ferry industry has the highest cart abandonment rate, accounting for 98%, and thus, it needs improvement.
| Industry | Cart Abandonment Percentage |
| Cruise & ferry | 98% |
| Mobile providers | 90.76% |
| Airline | 90% |
| Luxury | 87.93% |
| Fashion | 87.79% |
- The grocery sector has the lowest cart abandonment, at 50.03%, showing that less investment and marketing efforts are needed to drive sales.
- Around 80% of the cart abandonment is the same in the travel & booking sectors.
- Luxury, home goods, and fashion have the highest abandonment rates, likely due to higher prices, extensive product selection, and the nature of impulse & intentional purchases.
- Groceries and Electronics experience comparatively lower abandonment rates, which may be attributed to more immediate purchase needs or lower price points that encourage faster decision-making.
Cart Abandonment and Demographic Statistics
- 21% of customers aged 25 to 34 show the highest tendency to abandon their carts.
- 20% of customers aged 35 to 44 also report abandoning their shopping carts, indicating high drop-off rates among middle-aged shoppers.
- 81% of respondents in a recent survey reported abandoning a cart at least once.
Cart Abandonment and Customer Behavior Statistics
Now, let’s understand some key stats on consumer behavior and why they abandon their carts:
- 48% of consumers abandoned their carts simply because they were browsing and had no intention of purchasing at that moment.
- Over 82% of customers compare prices online before purchasing, indicating the importance of competitive pricing.
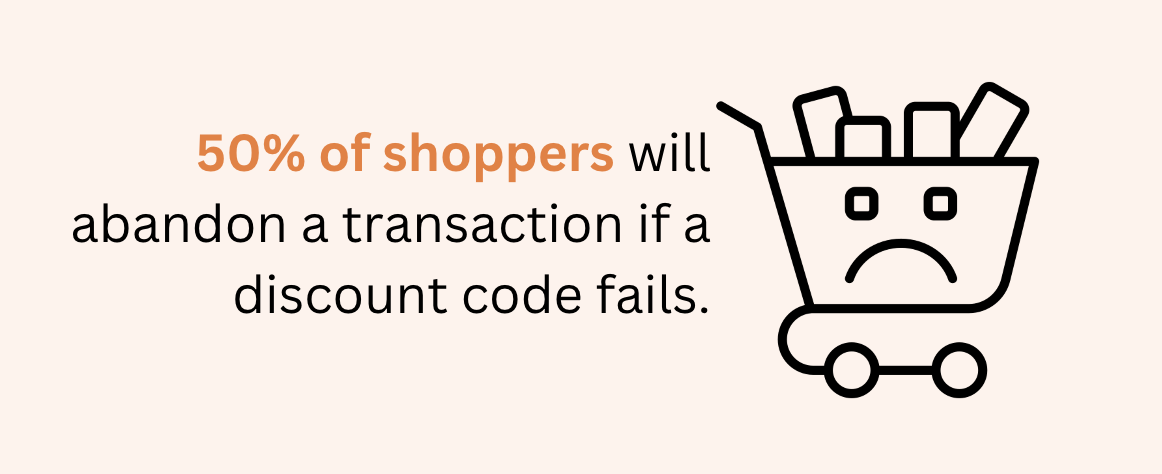
- 50% of shoppers will abandon a transaction if a discount code doesn’t work, and many leave websites searching for better deals.
Cart Abandonment Statistics by Device
- Around 80.2% of Cart Abandonment Rate is through mobile phone devices, which means that out of every 10 orders, only 2 are purchased.
- Tablets are the second-highest devices, with a 72.3% cart abandonment rate compared to desktop devices, which have a lower rate of 70%.
- The operating systems with the highest cart abandonment rate are:
- iOS (82%)
- Android (81%)
- OS X (72%)
- Windows (more than 68%)
- The conversion rate in the US in 2022 is 3% for desktop and tablet, while it is only 2% for mobile.
Mobile Cart Abandonment Statistics
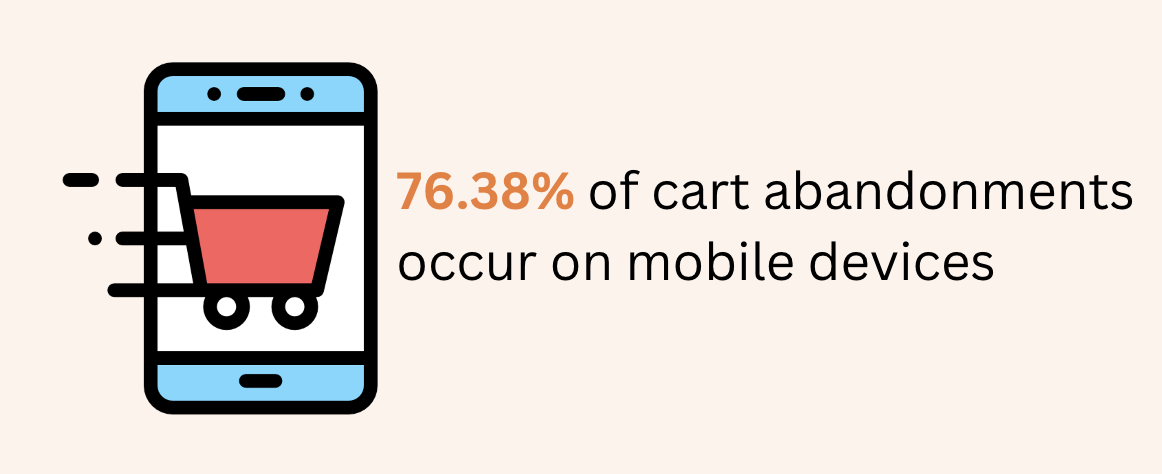
- 76.38% of cart abandonments occur on mobile devices, the highest rate compared to desktop devices.
- Mobile phones have one of the lowest conversion rates across regions like Great Britain (4%) and the US (2%) to EMEA (1%) and others (1%).
- You could improve by over 35% conversion by keeping the website mobile-friendly and designing a better checkout design.
- The mobile cart abandonment gap has been reduced to 16% in 2020 compared to 2017.
Cart Abandonment During Checkout Process
- 48% of customers abandon their carts due to extra costs like shipping, tax, and fees.
- Around 22% of shoppers abandon their carts due to a checkout process that’s too long or complicated.
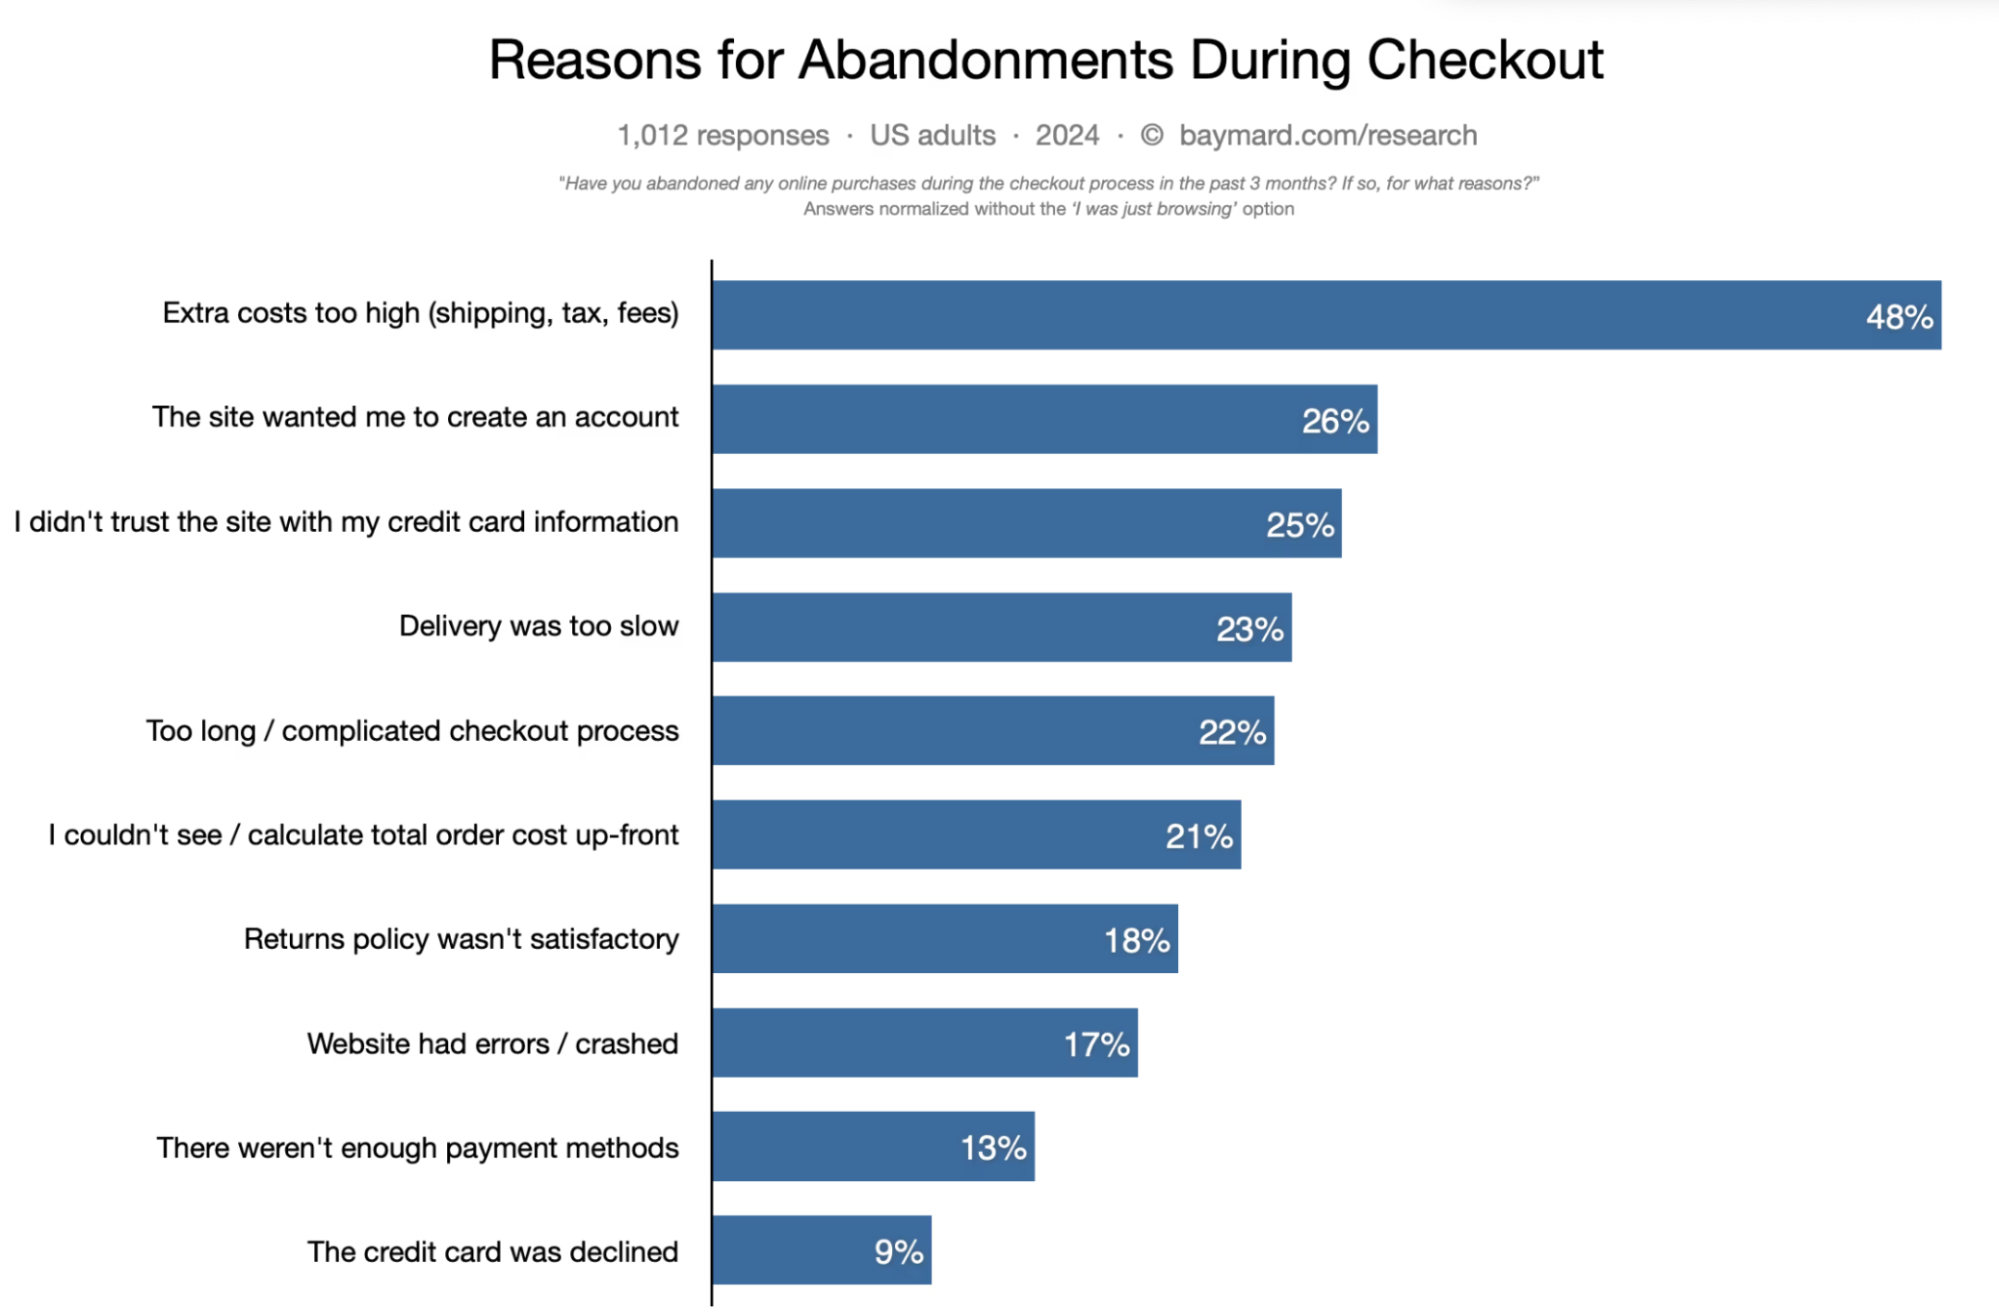
- 25% of shoppers abandon their purchase due to untrustworthy payment gateways or limited payment options, which shows the importance of offering secure and multiple payment methods.
- Around 26% of customers abandon their carts if the website wants to create an account before purchasing.
- 23% of customers also leave their carts abandoned if the delivery is too slow.
- About 18% of customers didn’t finish their purchases if they found an unsatisfactory or inconvenient return policy.
- 9% of carts are often left abandoned if the credit card was declined while making payments.
Suggestion: You can improve the 35.26% conversion rate of abandoned carts by simplifying the checkout process, enhancing the design, and offering secure payment options.
Cart Abandonment Recovery Statistics
Now, let’s see some of the abandoned cart recovery statistics:
- Cart recovery emails have an average open rate of 39.07% and a click-through rate of 23.33%, making them one of the most effective recovery strategies.
- Over 29.9% of carts can be recovered using email campaigns created with personalized content and offers.
- Retargeting ads, particularly when paired with personalized messaging, can increase the chance of recovering abandoned carts by 26%.
- Push notifications, on average, have a 50% open rate and a 10% click-through rate and are the best way to remind shoppers to return and complete their purchases.
Next Action
Cart abandonment is a big problem for online stores. But if businesses understand why it happens and pay attention to what customers do, they can take steps to fix this and increase their sales.
If stores understand why customers abandon their shopping carts and use tricks like sending reminder emails or making the website easier to use, they can stop more people from abandoning them.
By following these insights, businesses can make shopping easier for customers and turn empty carts into actual sales.
Source: Statista, Baymard, SaleCycle, Monetate, Kibo, Moosend, Contentsquare, Hashtagpaid